Happy Stats

Happy Stats is a lightweight analytics dashboard built for developers who want clear insights without complex setup. It visualizes metrics like commits, deployments, and project activity in a fast, privacy-friendly way.
Projects, photos, and experience are Echo examples. Personal content will follow.
Project stack

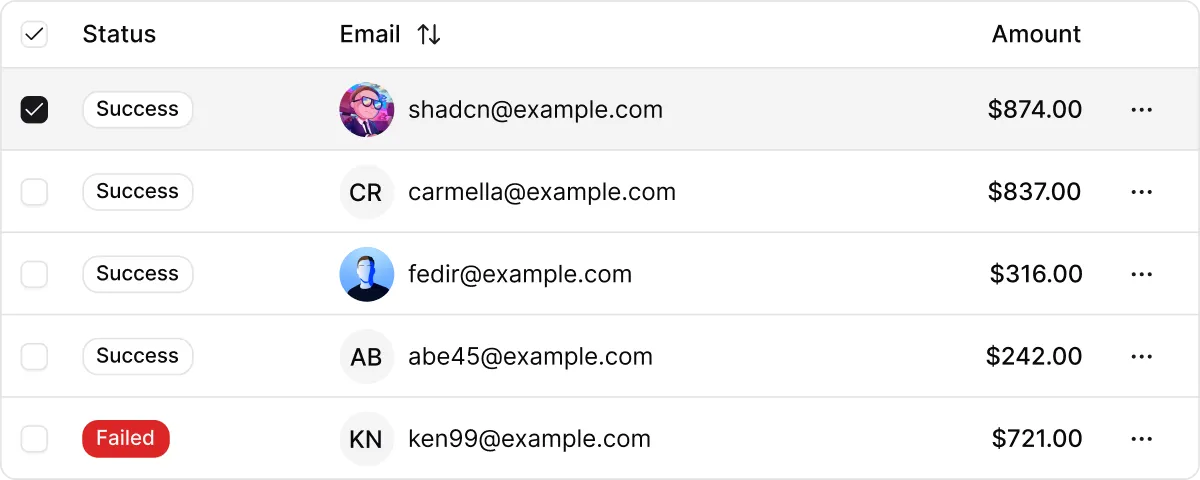
Beyond the technical build, Happy Stats was also an exercise in product thinking. I wanted to design analytics that developers would actually enjoy using — clear typography, instant feedback, and no unnecessary clutter. Every chart was tested against real-world commit data to make sure it told a story at a glance. Building it reminded me how powerful simple, focused tools can be when they're made by someone who uses them every day.
Highlights
- Built a modular charting system using Recharts for clean, customizable visuals
- Designed a real-time update flow powered by Supabase subscriptions
- Implemented role-based dashboards for teams and solo developers
- Optimized queries for large datasets using PostgreSQL window functions